System load monitoring with Monit allows you to keep a check on your home server or web server. Monit is an automatic monitoring, maintenance, and repair utility for Unix systems. If the resource usage is high Monit will send you an email alert. You can then examine and resolve any issues. In this Monit tutorial, I will show you how to monitor server load with Monit. By server load I mean the load on the CPU, memory usage, swap partition usage, and system load in general. I am assuming that you have already installed and configured Monit following my previous guide.
Monitor your home server with Monit:
- Home server system load monitoring (CPU, RAM, Swap)
- Server hard drive storage monitoring (HDD space)
- Motherboard temperature monitoring
- Processor or CPU temperature monitoring
- Monitor Hard drive SMART health and temperature
- Monitor file server status (Samba and NFS)
- Monitor web server status (Apache, NGINX, and MySQL)
- Monitor CouchPotato process status
- Monitor SickBeard process status
- Monitor SickRage process status
- Monitor SABnzbd process status
- Monitor Webmin process status
- Monitor qBittorrent process status
- Monitor Transmission process status
- Monitor ShellInABox process status
System Load Monitoring with Monit
It is required that you have a working Monit instance with a proper /etc/monit/monitrc file. Monit configurations for various services are loaded from /etc/monit/conf.d folder. To monitor server load with Monit, create a Monit configuration file using the following command:
sudo /etc/monit/conf.d/systemload
Copy the following contents to it, save, and exit (press Ctrl X, press Y, and press ENTER).
# domain.com could be IP, hostname, or localhost
check System domain.com
    if loadavg (1min) > 4 then alert
    if loadavg (5min) > 2 then alert
    if memory usage > 75% then alert
    if swap usage > 25% then alert
    if cpu usage (user) > 80% then alert
    if cpu usage (system) > 30% then alert
    if cpu usage (wait) > 20% then alert
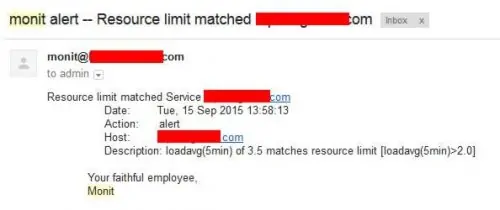
This code will make Monit send you an email alert when one of the above conditions (eg. average load is >4 for at least 1 min or when more than 75% RAM is full) are met. You can customize the above rules as you please. Below is an example email alert sent by Monit along with a description of what condition caused the alert.

The conditions I have listed are good for general purposes. But if you have a very low power system or a low RAM system then that may trigger alerts more often as it is quite easy for the resource usage to be high. The reverse is also true. In such cases, I would set load time length or load value higher or lower.
Test and Reload Monit
Once you make any changes you have to test Monit configuration:
sudo monit -t
You should see the following message: Control File Syntax OK. Then, check to see if Monit is already running using the following command:
sudo /etc/init.d/monit status
If Monit is running, reload Monit configurations using the following command:
sudo /etc/init.d/monit reload
If Monit is not running, then start it using sudo monit command instead. The whole sequence of commands for testing and reloading Monit is shown in the picture below.
Now, fire up your web browser and visit one of the following URLs depending on how your Monit is configured (be sure to use the correct port number):
- http://localhost:2812
- http://IPADDRESS:2812 (local network IP)
- http://domain.com:2812 (if you have domain name pointing to your server)
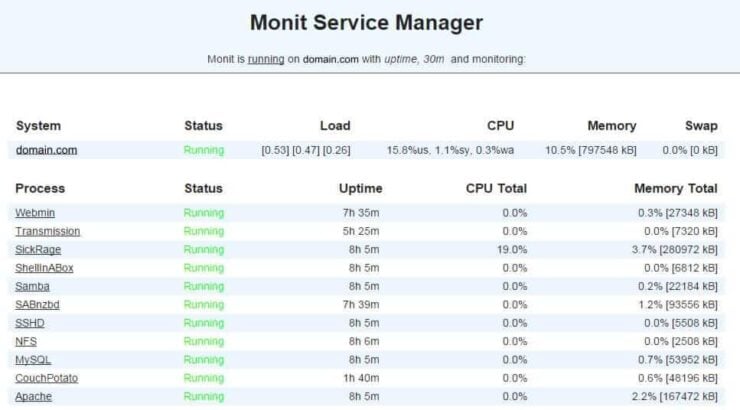
You should see the system status, load, CPU load, Memory Load, and Swap load as shown in the picture below.

That is it for system load monitoring with Monit. As you can see Monit allows for automatic server monitoring, which can be a big help for system administrators. Monit Wiki page has several examples. More home server specific Monit examples to follow, so keep checking back.


![Ultimate Docker Server: Getting Started with OS Preparation [Part 1] Docker Server Tutorials 1 OS Preparation](https://www.smarthomebeginner.com/images/2024/01/Docker-Series-01-Intro-and-OS-Prep.png)