I have been thinking about writing a series of guides for home lab and smart home monitoring using various databases, including InfluxDB and Prometheus, and Grafana. Previously, I wrote about installing InfluxDB on Docker. Grafana on Docker is the next logical step.
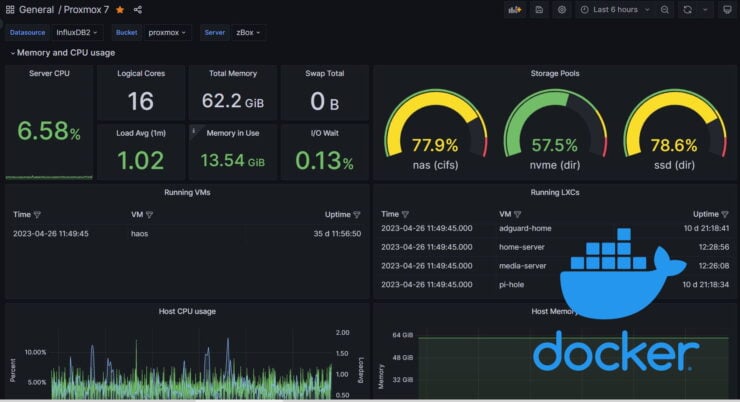
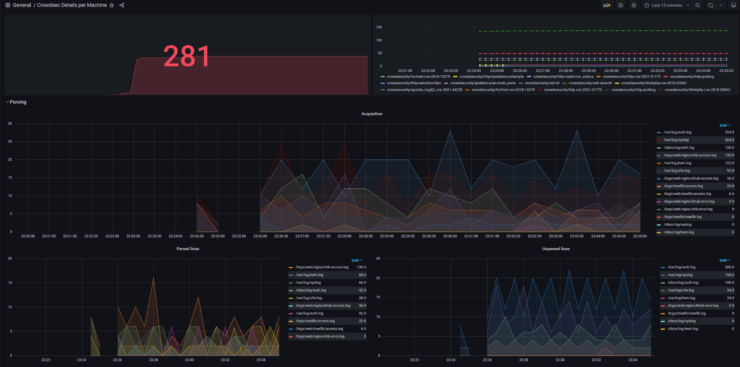
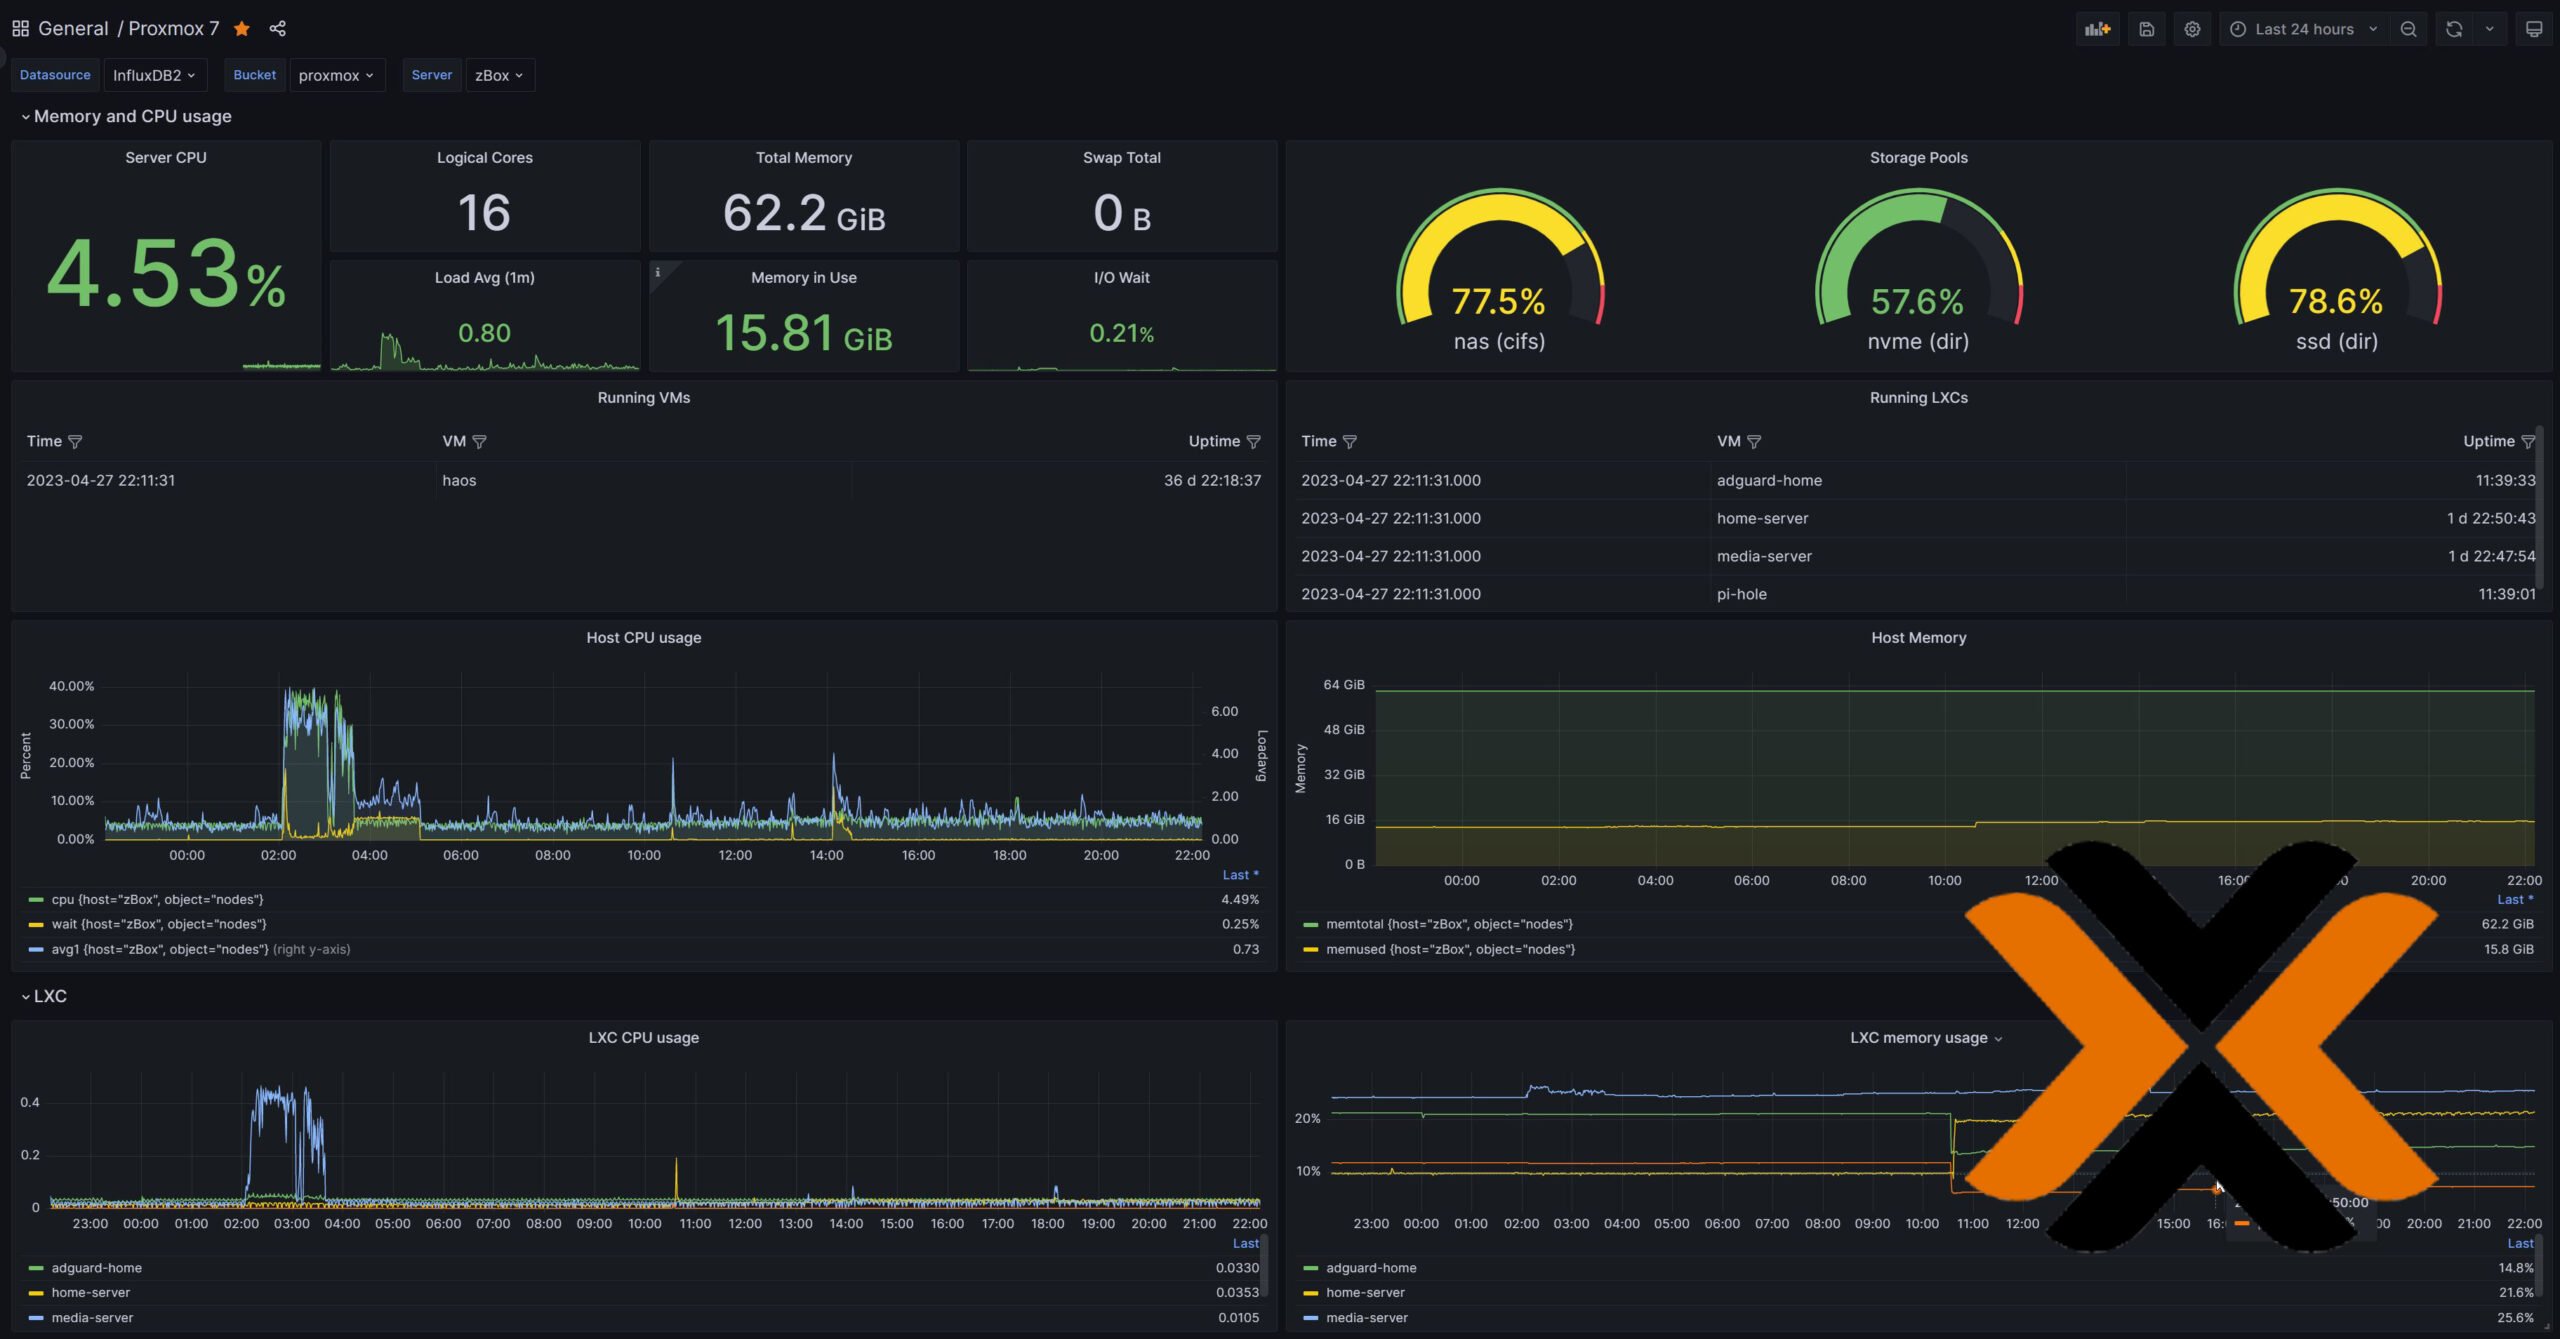
First, I plan to cover the installation of individual components and then future posts will include example use cases and applications for homelab monitoring. I have integrated Grafana with InfluxDB, Prometheus, and Loki to visualize metrics and logs from Home Assistant sensor, Docker Containers, Proxmox Server, CrowdSec, Sonarr, Radarr, etc., and it has been awesome.
Grafana is one of the apps that made it into our list of best Docker containers.
In this post, I will share my working Grafana Docker Compose file and explain how to implement it in minutes. Be warned that we won't be doing any fancy dashboarding in this guide. I will cover those in future posts. So stay tuned.
Table of Contents
What is Grafana?
Grafana is an open and composable observability and data visualization platform that allows you to visualize metrics, logs and traces from Prometheus, Loki, Elasticsearch, InfluxDB, Postgres, and others.
Client-side graphs and panel plugins provide many ways to visualize metrics and logs. Grafana also allows you to create your own dynamic dashboards mixing many different data sources into the same graph.
Grafana also allows you to use ad-hoc queries and dynamic drill-down, designed with split-view capability for side-by-side comparison. Grafana Alerting can send alerts through notifiers such as PagerDuty, SMS, email, VictorOps, OpsGenie, or Slack. You can use dashboards and add features from plugins available in the official library.
Grafana Docker Compose Setup
Most Docker tutorials out there give you the Docker run command and ask you to copy-paste it into Portainer. [Read: Portainer Docker Compose: FREE & MUST-HAVE Container Manager]
Having used Docker for over 5 years (and being a person of non-IT background), I strongly suggest you take the time to learn Docker compose and build your stack using it.
Docker Compose gives you portability between systems. I can use the docker-compose files from my GitHub repo in my Ubuntu Server on Proxmox, my Ubuntu Server VPS on Digital Ocean, or even my Synology NAS and they will work the same.
Using Docker Compose for Grafana is, in my opinion, the easiest way.
1. Preparing to Setup Grafana Using Docker
Requirements
First, let us start with some requirements. I won't go into a lot of details as these have been covered in detail in my Docker Media Server guide. Here is a summary of the requirements before Proceeding.
- Install Docker on Ubuntu
- Install Docker Compose on Ubuntu
- You do not need a domain name for this tutorial, but if you are going to expose Grafana to the internet it may help (but still not required)
Setting Up The Docker Environment
This is also explained in detail in my Docker Guide. We are going to customize a few things with Docker before building the Grafana Docker Compose file.
First, is the folder structure. I like to house all of the docker-related files and folders in one location. I call it the Docker Root Folder. Our docker-compose.yml file, .env file, etc. will be located in this folder, as shown below.
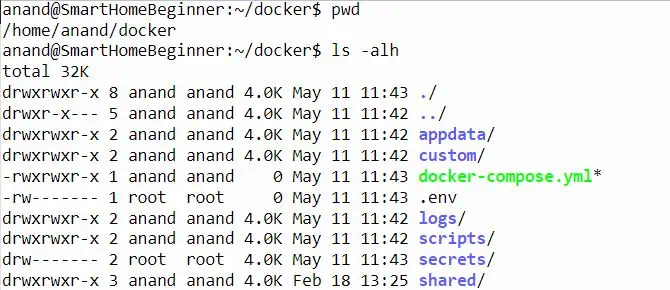
In addition, all of Grafana's data will go into the appdata/grafana folder. For this guide, you do not need to worry about the remaining folders in the above screenshot.
Create the .env file
First, the dot in front of env is not a typo.
It is a hidden file that will store some of the key Grafana docker-compose environmental variables. In the docker root folder (explained above), create the .env file and add the following contents to it.
PUID=1000
DOCKERDIR="/home/anand/docker"
Customizing the above variables is explained in detail in my Docker guide, along with the right permissions to set (very important!).
In short, PUID are the user's id, obtained using the id command and DOCKERDIR is the docker root folder mentioned above.
Replace 1000 and anand with your details.
2. Create the Base Grafana Docker Compose File
Before we go ahead and add the Docker Compose for Grafana, we will have to add a few basic elements to the compose file. Once again, this is all explained in detail in my Docker tutorial. But here is a summary of it.
In your Docker Compose file, if you do not already have it, add the following:
version: "3.9"

########################### NETWORKS
networks:
  default:
    driver: bridge

########################### SERVICES
services:
We are specifying the version of Docker Compose reference to use and the default Docker bridge network. If you do not know what these are, do not worry.
We are going to make Grafana accessible using the Docker Host machine's IP, using Grafana's default port (e.g. http://192.68.1.112:3000). If you are working on the Docker host, you can also use http://localhost:3000/. For this purpose, the above network block is sufficient.
3. Docker Compose for Grafana
Here is the Docker-Compose for Grafana that I use. Add it right under services (pay attention to indentation):
  # Grafana - Graphical data visualization
  grafana:
    image: grafana/grafana:latest
    container_name: grafana
    security_opt:
      - no-new-privileges:true
    restart: unless-stopped
    networks:
      - default
    ports:
      - "3000:3000"
    user: $PUID
    volumes:
      - $DOCKERDIR/appdata/grafana:/var/lib/grafana
    environment:
      GF_INSTALL_PLUGINS: "grafana-clock-panel,grafana-simple-json-datasource,grafana-worldmap-panel,grafana-piechart-panel"
Customizing Grafana Docker Setup
Here are some notes to understand and customize the above Grafana Docker-Compose example :
- We are using latest grafana docker image.
- Grafana will belong to the "default" network. This is fine for now. For advanced configurations, keep reading.
- In the ports section, we are exposing port 3000 to the host, which is the default Grafana WebUI port. Therefore, Grafana will be available on the Docker host IP at port 3000. For example, my Docker host has an IP of 192.168.1.112. So Grafana will be available at http://192.168.1.112:3000.
- We are also specifying that Grafana service run as user id 1000, which is set using the environmental variable PUID.
- Under volumes, we are mapping persistent volume to store Grafana configuration.
- Under environment, we are installing a few Grafana plugins (there are many available plugins that provide additional chart types and more).
Customizing Network
In the above Grafana Docker Compose file, we set the network as default. This is fine.
Alternatively, you can specify the Grafana Docker container to use the host network. In this case, Grafana functions as if it were running natively on your host system. This requires all necessary ports to be free (e.g. 3000). To enable host networking, use the following block instead of networks:
network_mode: 'host'
In addition, you will also need to remove the ports section. Grafana should be available at http://192.168.1.112:3000, which is the same URL as the default Grafana docker compose setup shown previously.
Start Grafana
After customizing the Grafana Docker Compose file, you can start the Grafana container using the following command:
sudo docker compose -f ~/docker/docker-compose.yml up -d
Be sure to refer to my Docker guide to understand how you can follow the logs to check the start-up of the Grafana docker container. You may use Dozzle logs viewer for real-time logs viewing.
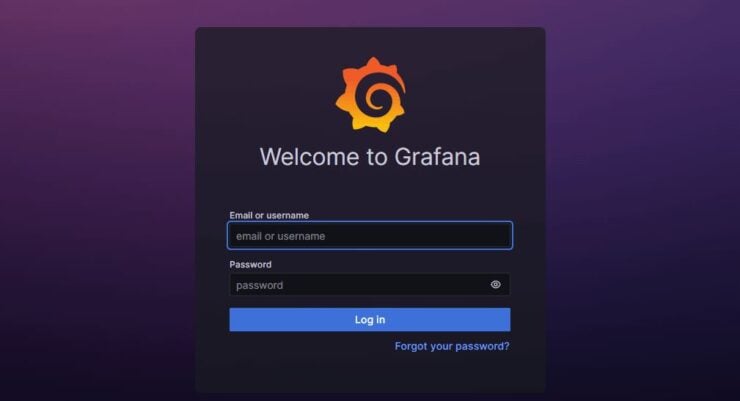
If all goes well, in a few minutes you should be to access Grafana using one of the URLs listed previously.
4. Grafana Setup
Grafana is a visualization tool. Without data, it is useless. There are numerous data sources, but in this series, I plan to focus only on InfluxDB, Prometheus (in the future), and Loki (in the future).
But before we add data sources, let's secure Grafana.
Grafana Default Login
During first login with Grafana default username (admin) and password (admin), you will be offered the option to set a new password. I usually hit Skip on this step.
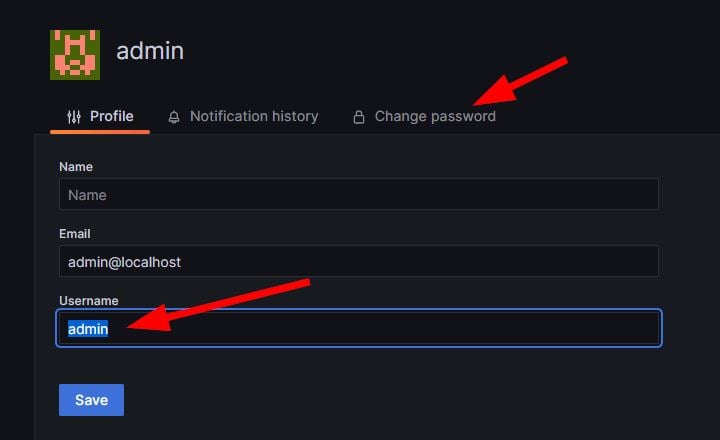
Instead what I recommend is changing both username and password from the profile page after login.
Grafana InfluxDB Data Source
Assuming you already followed my InfluxDB Docker compose guide and have it running, let us now add it as a data source for Grafana to consume.
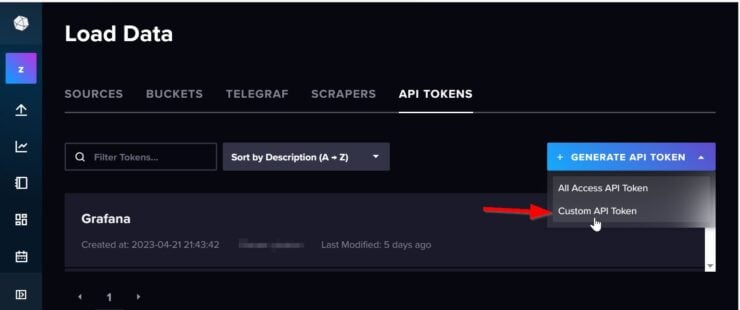
Open the InfluxDB web interface (e.g. http://192.168.1.111:8086), navigate to API Tokens, and create a custom API token for Grafana.
Provide any description (e.g. Grafana) and enable read access for all buckets (or specific ones).
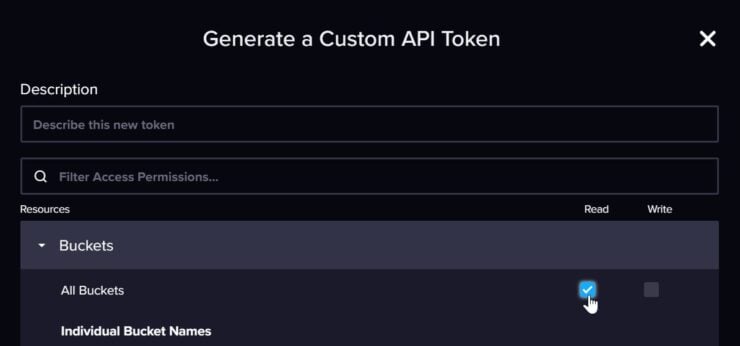
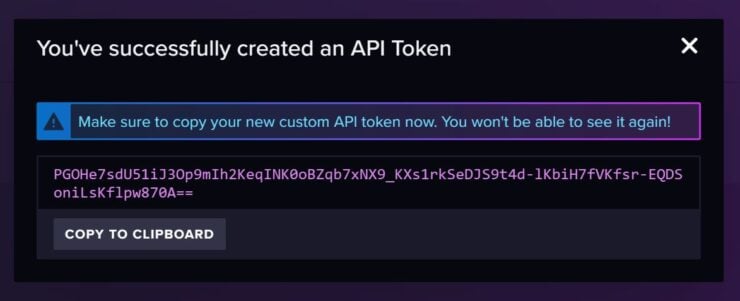
Hit save and note down the displayed API token (it will be shown only once).
Back on Grafana, under Data Sources, add InfluxDB. Since we are adding InfluxDB v2, I am naming it InfluxDB2. Pick Flux for the Query language. Provide the InfluxDB URL.
Disable basic auth (it will be enabled by default), as we are using an API token. Next, enter the organization name that you set on InfluxDB (in case you forgot, you can find it under InfluxDB profile settings).
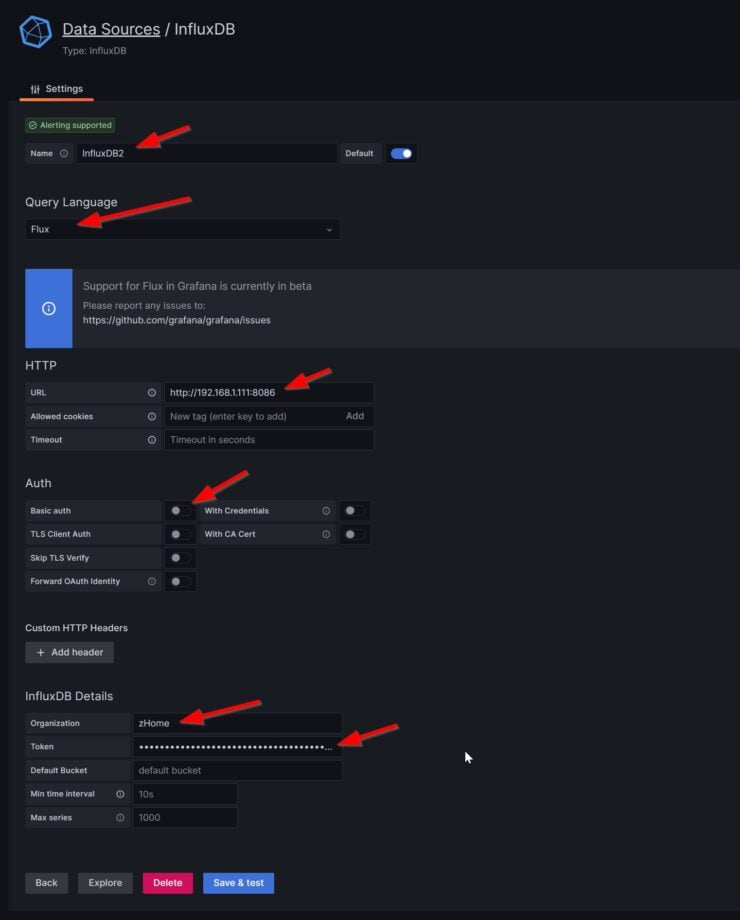
Lastly, enter the API token created previously and hit Save & Test.
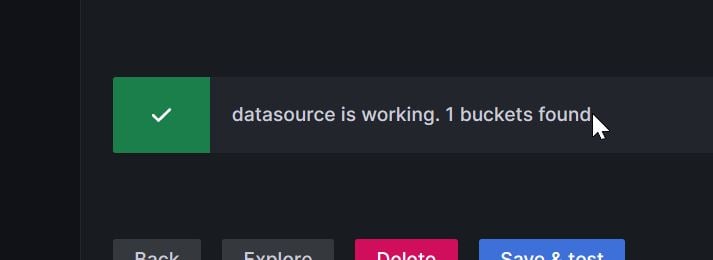
You should see confirmation that the data source is working. That's it you are all set to create Grafana InfluxDB dashboards.
5. Accessing Grafana Over The Internet
Accessing Grafana web UI from within your home network should work fine (described above). But what if you want access to Grafana from outside your home network (or your server and client are in different locations)?
Port Fowarding 3000
The easiest and NOT RECOMMENDED way to do this is to forward port 3000 on your router/gateway to point to your Grafana servers (Docker Host) IP address.
Accessing Grafana Web UI Remotely
A secure and recommended way to access the Grafana web interface is to put it behind a reverse proxy. But this requires a domain name or a DDNS.
Nginx Proxy Manager is very simple to setup but not very flexible.
I use and recommend Traefik. You can read all about setting it up in my Docker Traefik guide or refer to my GitHub repo.
With a reverse proxy, you can access the Grafana web interface using a nicer URL (e.g. https://grafana.example.com).
Secure Access using VPN
There are multiple ways to do this. It is better to cover those in separate guides.
- VPN on Router: If your router allows a VPN connection, you can connect to it remotely and immediately have access to Grafana using the Docker host URL mentioned previously.
- VPN Mesh Network: There are third-party services such as Tailscale and ZeroTier-One that offer free mesh network plans. I use ZeroTier to tie all my key machines together in a virtual network. My Docker host is part of this network. Therefore, from a remote machine, which is part of the ZeroTier network, I can use my Docker host's ZeroTier network IP address with Grafana port (3000). If you take this approach then you cannot use macvlan networking.
Another alternative is to set up your own Wireguard network. But this is a more advanced topic.
Other Posts in the Wireguard Series:
- Wireguard VPN Intro in 15 min: Amazing new VPN Protocol
- Complete Wireguard Setup in 20 min – Better Linux VPN Server
- Wireguard Windows Setup: Powerful VPN for Windows
- Wireguard Mac OS Client Setup – The sleek new VPN
- Wireguard Android Client Setup – Simple and Secure VPN
- Ultimate WireGuard Docker Compose: with CF and Traefik Support
6. Grafana Dashboard Tutorials
FAQ
How to use Grafana with Docker?
Docker is the easiest way to install Grafana. Once installed, Grafana is available through the machine's IP address and port 3000 (e.g. 192.168.1.112:3000).
How to run Prometheus and Grafana using Docker Compose?
Both Prometheus and Grafana can be run using their respective Docker Compose. Please refer to Anand's GitHub Repo or this article series for docker-compose examples.
Do you need Docker for Grafana?
No, you do not need Docker to run Grafana. But docker makes the installation of many apps easier, including Grafana. Docker-compose simplifies the process even more.
How to install Grafana plugin in Docker?
Grafana plugin names can be passed on as environmental variables during the creation of the container. For example, setting the environmental variable GF_INSTALL_PLUGINS to "grafana-clock-panel" (additional plugins as comma-separated list), will install the grafana-clock-panel plugin during container creation.
Can Grafana work without Prometheus?
Yes, Grafana can work without Prometheus, which is just one of the many data sources available for Grafana.
What are the system requirements for Grafana docker?
Grafana recommends a minimum RAM of 255 MB and 1 CPU to provide a better user experience.
What's Next After Setting Up Grafana on Docker
Well, setting up Grafana using Docker Compose is just the beginning. The real magic starts after.
The possibilities are endless. You could start visualizing your sensor data from Home Assistant, you could keep tabs on your home server's or docker container resources using glances or CAdvisor, monitor CrowdSec IPS's metrics, etc. With Alert Manager, you can even trigger notifications if something went wrong.
You could also monitor your Radarr and Sonarr apps and monitor the stats on your collection.
Stay tuned for specific guides on how to accomplish the above.
Installing Grafana natively on operating systems is not difficult. But Docker makes it much easier to install Grafana, and Docker Compose simplifies it even more. With the included Grafana Docker Compose and easy steps to install Grafana, you should be up and running in just about 5 minutes.

