Let's face it, dashboarding is cool. It is one way to show off all the hard work you put into setting up your homelab.
As said in my previous guides, I have been meaning to publish a series of guides on dashboarding. I started with setting up InfluxDB, followed by Grafana Docker guide.
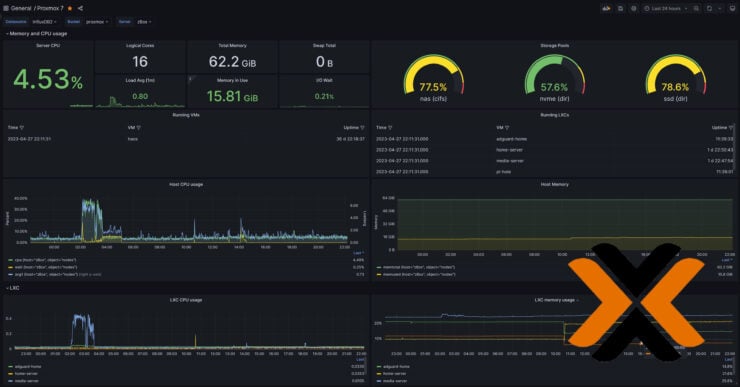
Now, I have all the ingredients in place to share my first guide - Proxmox Grafana flux dashboard, using InfluxDB 2 as the data source.
Prometheus is another common data source, but Proxmox supports InfluxDB from the UI and so I went the Proxmox InfluxDB Grafana route. Let's begin.
Table of Contents
Proxmox Grafana Flux Dashboard Setup
Step 1. Requirements for Proxmox Grafana Dashboard
At this point, the assumption is that you have both InfluxDB and Grafana running. If not, follow the guides linked below first:
- InfluxDB Docker Compose: An efficient timeseries DB for Metrics
- Grafana Docker Compose: Build Awesome Dashboards
Once done, let's move on to Grafana Proxmox flux dashboard setup.
Step 2. Setup Proxmox Bucket on InfluxDB
Although this is possible using the commandline, we are going to do this using the InfluxDB 2 web interface.
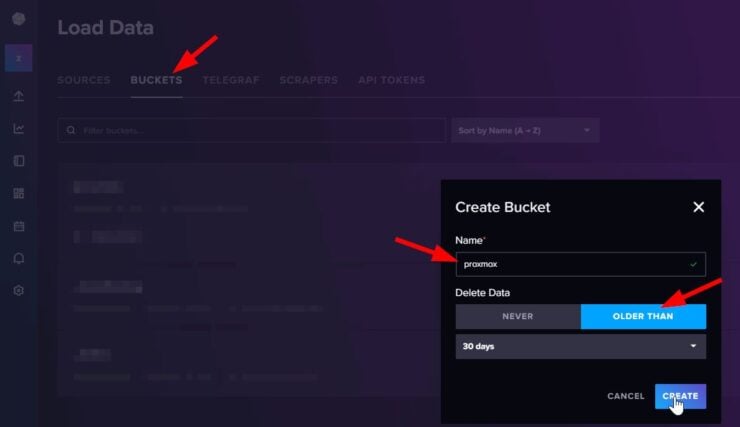
Log in to your InfluxDB web interface and create a new bucket called proxmox (or whatever). Optionally, set it to automatically purge old data. In this Proxmox Grafana dashboard example, I am picking the default 30 days. Hit create to complete this step.
Next, you will have to create a custom API token for Proxmox to be able to access InfluxDB and write metrics to it. Under Load Data -> API Tokens, create a custom API token, with only write privilege to the proxmox bucket we created previously.
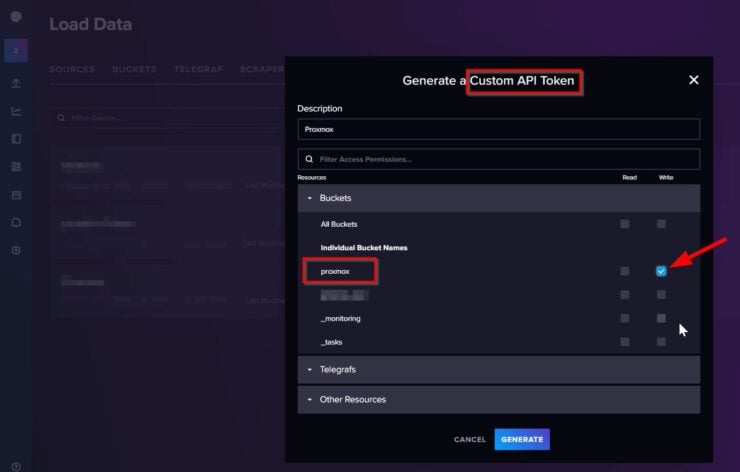
Hit Generate and note the API token. That's it, we are done with InfluxDB.
Step 3. Setup Proxmox Metric Server
To configure Proxmox metric server, go to Datacenter -> Metric Server on Proxmox web interface. Proxmox has built-in support from the web interface for passing the metrics to two databases: InfluxDB and Graphite.
Since I have also used InfluxDB as the recorder for my Home Assistant, I decided to use the same InfluxDB TSDB.
Pick InfluxDB and provide the connection details: Name, Server, Port, HTTP, and Organization (these should be available after following the InfluxDB setup guide). Bucket name and API token are available from the previous steps in this Grafana Proxmox tutorial.
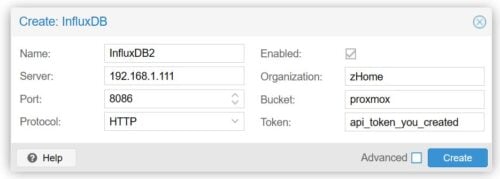
Hit Create and proceed.
Step 4. Verify Proxmox Metrics on InfluxDB
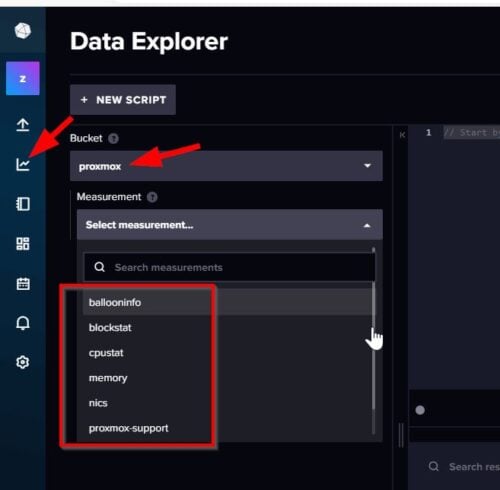
Now its time to check if Proxmox is sending metrics to InfluxDB. Head over to InfluxDB Data Explorer, as shown below. Pick the proxmox bucket.
If you are able to items in the Select measurement... dropdown then ... jump around a few times 😎 and come back.
Step 5. Create Proxmox Grafana Dashboard
The final step is to consume the Proxmox metrics from InfluxDB database to build kick-ass dashboards. If you followed my Grafana Docker guide, you should already have it setup InfluxDB as a data source in Grafana.
The wonderful thing about Grafana is that there are many pre-built dashboards available that you can reuse in minutes without much work.
At the time of writing this guide, there are over 30 Proxmox InfluxDB Grafana dashboards available.
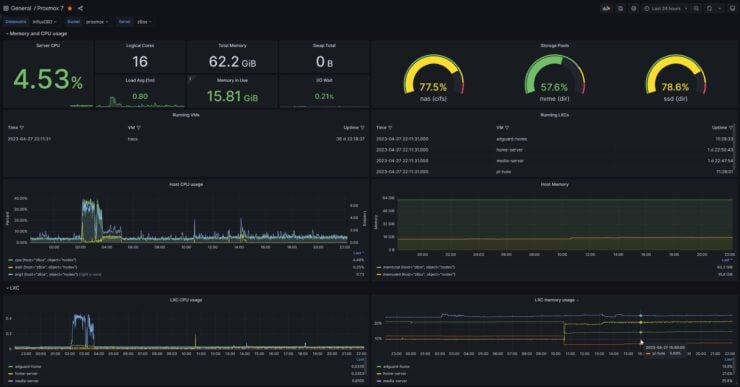
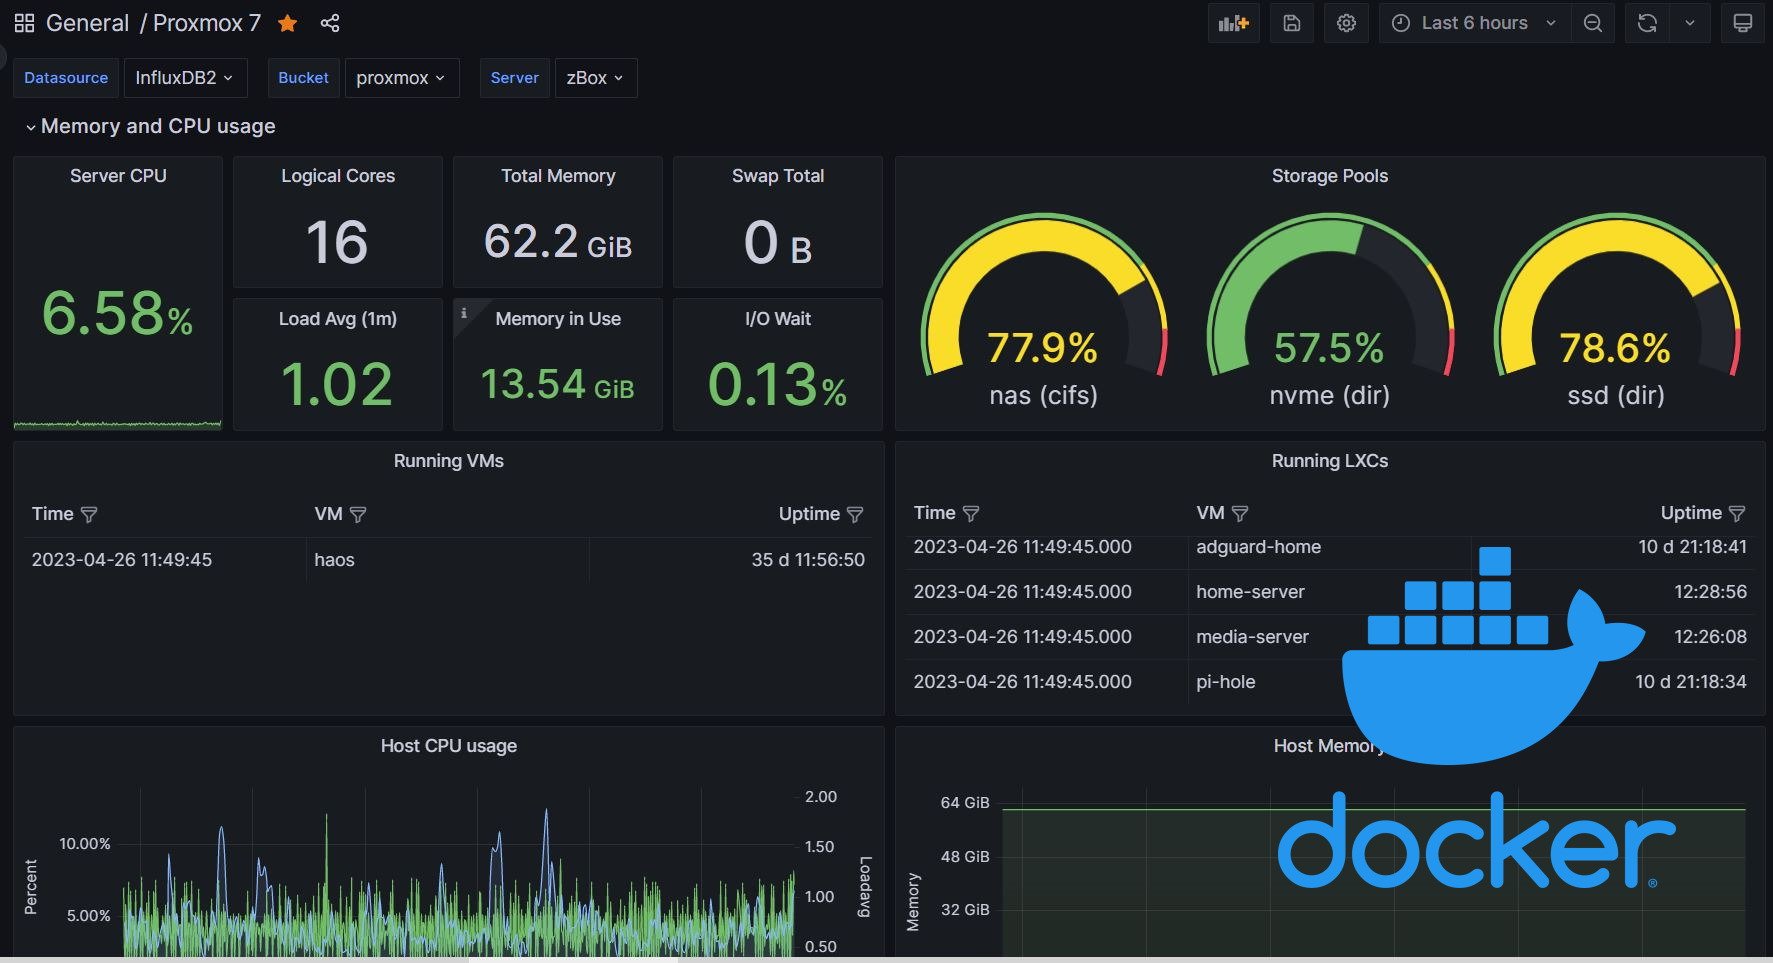
I stole mephisto's Proxmox Flux dashboard (ID 15356) and modified it to include some dial gauges instead of bar gauges. I just think dial gauges look cooler.
Here is what I came up with:
Now let's see how to add the above dashboard to your Grafana.
Copy Dashboard ID
I have published my Grafana Dashboard for Proxmox in the dashboard repository (ID 18621). What you really need is the ID number, which is 18621.
Add Proxmox Dashboard to Grafana
Now back on Grafana, go Dashboards and import a new dashboard as shown below.
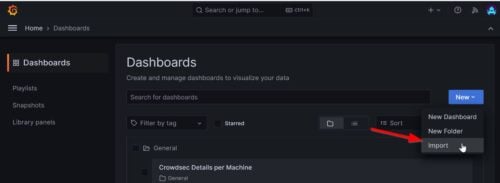
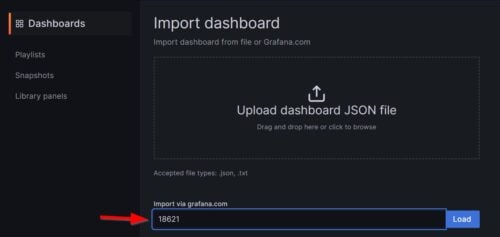
Enter, ID number 18621 and hit Load. Most of the information in the following screen should be pre-populated.
Typically, the only thing you will need to do is pick your InfluxDB 2 data source from the drop-down.
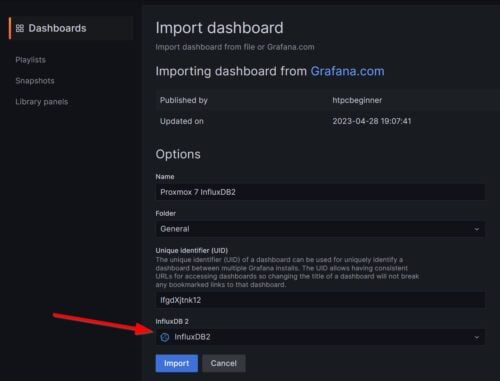
Hit Import and Voila! Your wonderful Proxmox Grafana InfluxDB dashboard should be ready to go.
FAQ
How do I monitor proxmox with Grafana?
To monitor Proxmox in Grafana, you will first have to configure a Metric Server to send metrics to a database such as InfluxDB. Then, define this database as a data source in Grafana. Finally, you could use one of the pre-built Grafana dashboards available for Proxmox to visualize the data.
Can you embed Grafana?
Yes, you can embed charts/panels from Grafana. Click on any panel and then Share to see what options are available for embedding.
Can I use Grafana without Prometheus?
Definitely. Prometheus is just one of the data source options. Grafana is capable of connecting to various data sources, including InfluxDB, Loki, MariaDB, Elastisearch, Graphite, OpenTSDB, and more.
Does Grafana require license?
Grafana is free to use for homelabs and enthusiasts. An enterprise license is available for larger-scale usage.
How do I integrate Grafana and InfluxDB?
InfluxDB can be integrated with Grafana by adding it as a data source. Once added, use the data explorer to check incoming data and verify the integration.
So You have a Grafana Dashboard for Proxmox, What Next?
Dashboarding is cool but it is also a rabbit hole. If you hardly ever look at a dashboard than the thrill and "cool" factor of setting up one, you get no real benefit out of it.
Personally, in the past, I have sent specific charts over to my Home Assistant view, which is available through my motion-activated Android tablet wall panel for me to see. Grafana also has alerting capabilities, which I will probably explore in a future post. If certain abnormal behaviors are seen, you could alert someone.
You could also combine Grafana with Alert Manager, which is an even more powerful workflow. May be something I will explore in a future guide.
For now, I hope you enjoyed this tutorial on monitoring Proxmox with InfluxDB and Grafana. Feel free to share your ideas with others in the comments.

